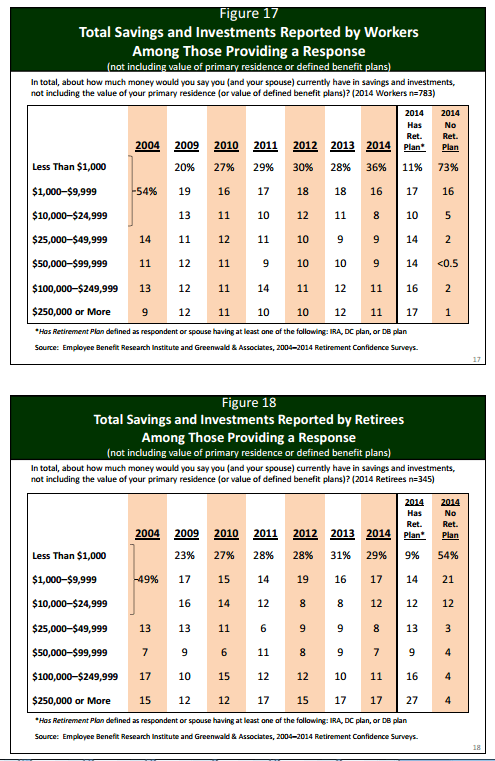
From ebri.org, that is, the Employee Benefit Research Institute, a table on actual savings, by workers and retirees, as reported in a 2014 survey. “Workers” included survey respondents ages 25 and up, and “retirees” included respondents of any age who said they were retired, so of course you’d expect younger respondents to have less savings, and older retirees to have spend down a lot of savings, but:
52% of workers have less than $10,000 in savings, and 60% have less than $25,000, and
46% of retirees have less than $10,000 in savings, and 58% have less than $25,000.
Here’s another table, from a supplementary fact sheet:
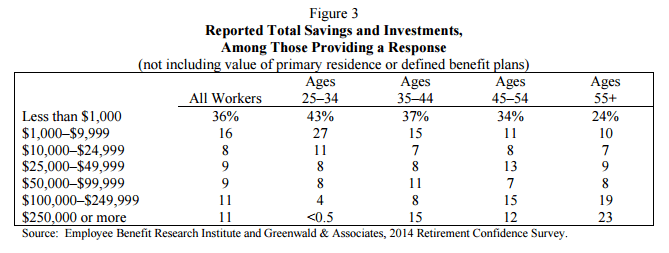
Which, again, indicates that very few workers nearing retirement age have sufficient savings to provide a comfortable income in retirement.
And, as a point of reference, here are the replacement rates from Social Security (assuming full earnings careers), at “normal retirement age”:
Very Low Income = $11,282 => 76% of pay
Low Income = $20,308 => 55% of pay
Medium Income = $45,128 => 41% of pay
High Income = $72,206 => 34%
Maximum Income = $108,570 => 27%
Appropos of nothing, but I was thinking about this, pulled up the data, and thought it’d be worth sharing.
Update:
Here’s some more data: a table from the census bureau on household income levels by age.
For the age group 55 – 65, the 1st quintile breakpoint falls at the $20 – 25K income level.
The 2nd quintile, at $45 – $50K.
The third, at $75 – 80K
The 4th at $120 – $125K.
OR, since we have the data point that 24% of this age group have saved less than $1,000, the income level that corresponds to 24% of this age group is $25 – 30K.
34% have saved less than $10,000; that corresponds to incomes of $35 – 39K.
41% have saved less than $25,000; and the 41st percentile income is $45 – $50K.
50% have saved less than $50,000; the 50th percentile = median is $60 – $65K.
58% have saved less than $100,000; the 58th percentile is $70 – $75K.
and 77% have saved up to $250,000; the 77th percentile is $115 – $120K.
So these are sucky savings rates when paired up with the corresponding income levels, if you assume that everyone saves in a consistent proportion to their income. Sure, this is household income compared to individuals asked about their savings, so conceivably some respondents could be splitting out “my” vs. “my spouses'” savings, and the younger people in this age group still have some time to save. And conceivably these survey-based results are faulty in the first place if people don’t think their 401(k) our IRA accounts should be included in the question, or that they are significantly more likely to underestimate than overestimate their savings.
And there’s your data for the day.