So at his quasi-State of the Union, President Trump (I know, it’s strange to be using that title) said that there were 94 million people out of the labor force, and the AP, in its fact check, said, “you dummy, this number includes all the retirees, and the disabled, and stay-at-home parents, and students, etc., etc., so that’s not any evidence of a real unemployment problem.”
OK, actually, they said,
That 94 million figure includes everyone aged 16 and older who doesn’t have a job and isn’t looking for one. So it includes retirees, parents who are staying home to raise children, and high school and college students who are studying rather than working.
They are unlikely to work regardless of the state of the economy. With the huge baby-boomer generation reaching retirement age and many of them retiring, the population of those out of the labor force is increasing and will continue to do so, most economists forecast.
It’s true that some of those out of the workforce are of working age and have given up looking for work. But that number is probably a small fraction of the 94 million Trump cited.
And economist Mark Perry pulls up the details, that of the 94 million (counting those ages 16 and up):
88.5 million are classified as “not in the labor force” – the remainder are unemployed but looking for work.
of this group, 45% are retired,
18.6% are disabled or ill,
18% were full-time students,
15.3% were people with “home responsibilities” (that is, people who reported being stay-at-home parents, caretakers for an elderly or disabled relative, or simply voluntary housewives),
and the remainder, a mere 3.1%, were in the “other” category – the layabouts playing video games in Mom & Dad’s basement.
So, problem solved, right?
After all, it’s a good thing that more people are in college, and it’s only natural that in an aging population, there’d be more retirees than before.
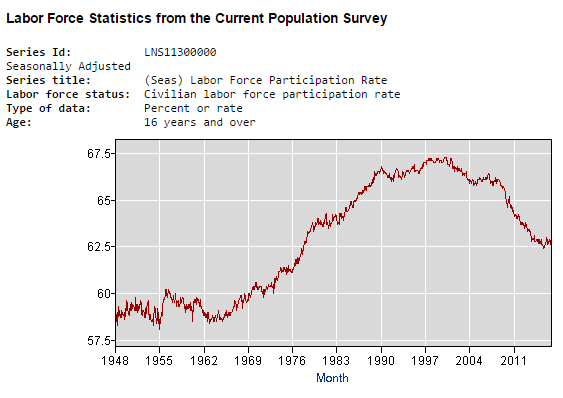
But look at the Labor Force Participation Rate:

There are two issues here:
First, even if there are more students and more retirees, there is still a cause for concern with respect to the impact on the dependency ratio. Usually this is expressed as the “old-age dependency ratio” – the number of workers available to support the elderly in a society. But — though I’ve not seen this particular metric — there is another sort of dependency ratio: each student, each retiree, each sick or disabled person has to be supported by others, whether it’s by family, or by the government, or by their future selves (in the case of students with loans).
And for as many of the people in this non-working group who clearly belong there — my 78 year old parents, for instance — there are others who would, in a different set of circumstances, be working: the students who are seeking college degrees because employers demand them for work that in itself doesn’t require any more than a high school diploma, the retirees who left the workforce because they couldn’t find a new job due to age discrimination (and are “not in the labor force” because they abandoned looking) or who left voluntarily but really shouldn’t have due to inadequate retirement savings; the disabled who would be able to work with accommodation or who shouldn’t really be disabled in the first place (that is, the addicts of various kinds); the stay-at-home parent whose potential income is too low to cover the cost of childcare or who defers re-entering the workforce because of the expectation that it’ll be too difficult to find a well-paying job.
Second, even for the prime working age group, there has been a drop, and, what’s more, there is a considerable variance between men and women; the OECD data shows this split:

(Strictly speaking this is the employment rate rather than the labor force participation rate, which also includes jobseekers. To be honest, I just wasn’t able to find the latter rate split out by sex for this “prime working age” group, but the patterns still hold true.)
The drop in male labor force participation, post-college, pre-retirement, has been a long-term trend, which was offset by the increasing participation of women in the paid workforce, up until the late 90s, when it has been declining, even when considering men and women together.
Which means that there are “future of men” reasons to be concerned as well.
Of course, the total labor force participation rate now, is at a level last seen in 1976. So maybe, in the same way as we all did just fine up until then, we’d be just fine with returning to lower levels? But that assumes we’re OK with returning to a prior generation’s lower material living standards and higher marriage rates.
Image: men participating in the labor force. OK, a photo of Waterloo Street in London, from our vacation.


