It is very rare that you can get on ONE page the economic history of the world – graphically! Here is one such page from a nice blog which referred to another. The message from the study is this: China and India who were the economic leaders of the world until just 200 years ago.. when the Western Europeans through colonization and industrial revolution took over.. are on road for a repeat. Between them they accounted for a little less than 60% of the world’s GDP in 1 AD.. it wasn’t until 1700 AD that the Western Europe even started a movement towards growth.
Given the way India has had so much of poverty and the way it has looked so chronic that most of the world believes that India was always so.. I can only imagine the thoughts and mindset of the Europeans in 1500 AD.. backward, poor, ignorant, superstitious and never knowing what good food was! THAT would have been a pretty bad situation! To come from there to where they are today is quite an achievement..
.. the pendulum of duality moves on…
Angus Maddison is a pioneeering macro economist who has devoted his academic career to studying the history of global economic growth. Adopting a quantitative framework, he has assembled GDP numbers that help us understand the impact of technology on civilization, going as far back as the historical record permits.
Based on the results of Professor Maddison’s research, incorporating purchasing power parity (PPP) adjustments, the graph to the right shows how the contributions of various countries and regions to world GDP have shifted over the past two thousand years:1 A.D.: In the first year of the Gregorian calendar, China and India represented the economic center of the world, together commanding 57% of the world’s GDP. At this time, with the Roman Empire approaching its prime, Western Europe accounted for a lesser 14% of the world’s GDP. By contrast, the American continents remained as yet largely “undiscovered,” deserving little more than a footnote in the annals of world economic history;
1500-1700 A.D.: A full millennium and a half later, the post-Renaissance period with its Age of Enlightenment vaulted Western Europe to new cultural and economic heights, allowing Europe’s GDP to catch up to China and India’s;
1820-1900 A.D.: The Second Industrial Revolution of the 19th century carried Western Europe’s GDP even higher, and also catalyzed the rapid rise of the U.S. as an important economic power.
1950 A.D.-present: Western Europe and its “offshoot” (Maddison’s terminology) U.S. economy represented about 54% of the world’s GDP in 1950, but this combined percentage has fallen over the past few decades to about 40% where it sits today. Following on the coattails of Japan’s economic growth spurt in the post-World War II years between 1950 and 1990, China (and India, though at a more moderate pace) has begun to rise again. Through accelerated growth, China’s economy has gone from representing just 4% to 5% of the world’s GDP in the decades (1949-1976) of Chairman Mao’s rule to more than 15% today.
Of course, much of reason for China and India’s dominant share of world GDP a millennium or two ago was the sheer size of their headcount (acknowledging, too, that favorable economic conditions allow populations to grow). Up until the mid-1800s, China and India each represented between 20% and 35% of the world’s population; in other words, the majority of the people in the world lived in either China or India. As the populations of Africa, Latin America and certain other regions of the world have grown at faster rates over the past century, today China is home to about 20% and India about 17% of the world’s population.
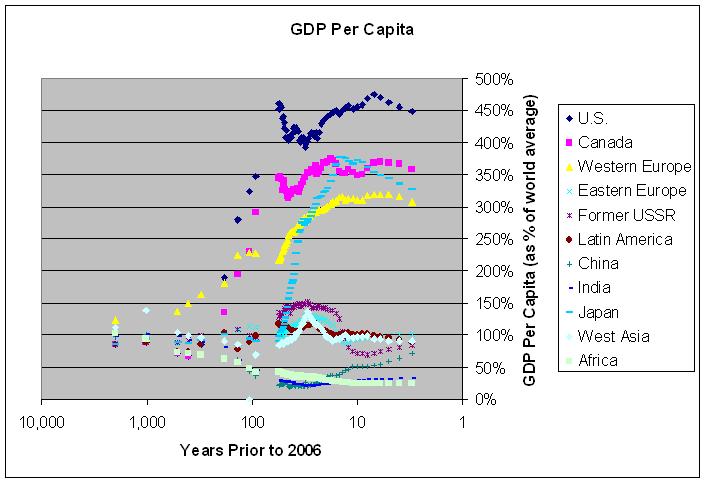
For examining trends in economic growth, more revealing than either GDP or population alone is what we obtain by putting the two together–GDP per capita. The graph to the right clearly exhibits the “economic divide” that has developed between countries of the world during the most recent 150 years. Driven by technological advancements, the U.S. and Canada, the consortium of Western European nations (particularly Britain, Germany, France and Italy) and, more recently, Japan (along with South Korea, Singapore, Hong Kong and Taiwan) have sprinted ahead of the remainder of the world in terms of GDP per capita. The U.S.S.R.’s economic strength temporarily rose above the global mean in the Cold War years (late 1950s through 1980s) but fell precipitously in the late 1980s with the collapse of Soviet Communism. During the most recent decade, the former U.S.S.R. (Russia) and Eastern Europe have been recording significant gains in GDP per capita, along with China and India.
Implications for Investors
What, then, is in store for the world in the upcoming century?
- First of all, on the basis of its large population (1.3 billion people) and rapid economic growth (9% to 10% per annum), it is almost a certainty (i.e., barring political disruption, social unrest or a large-scale war) that China’s economy will become the world’s largest in terms of GDP (again, on a purchasing power parity (PPP) basis) over the next decade or so.
- With its population projected to surpass China’s around 2030, India’s GDP will also rise, so that China and India will likely again jointly dominate the world’s GDP like they did up until about 150 years ago when technological advancement permitted “the West” to surge ahead.
- Assuming current growth trends continue, we should also expect Russia and Eastern Europe, along with a host of countries in Asia and Latin America, to cross the “economic divide,” joining the U.S., Canada, Western European nations and Japan. With the diffusion of technology, the result will hopefully be a bridging of the economic divide, with a more equal “spread” of country-to-country GDP per capita, somewhat akin to the world’s tighter per-capita wealth distribution two millennia ago.