
In the news yesterday, the Government Accounting Office released its report on the number and percentage of individuals receiving federal aid such as Medicaid and food stamps who were employed by such major employers as Walmart and McDonald’s. The study was, as is the norm for such studies, not initiated by the GAO, but based on a request from Sen. Bernie Sanders, and, as the rhetoric and reporting on the study makes clear, aimed to criticize those employers for offering wages that they deem too low.
Here is, in part, what the Washington Post had to say:
Sanders accused companies such as Walmart and McDonald’s of relying on “corporate welfare from the federal government by paying their workers starvation wages.”
“That is morally obscene,” he said in a statement to The Post. “U.S. taxpayers should not be forced to subsidize some of the largest and most profitable corporations in America.” . . .
A 2013 study from the University of California at Berkeley and the University of Illinois at Urbana-Champaign found that three-quarters of people in the country’s major public benefits programs such as Medicaid and SNAP came from working families. A follow-up report two years later found that the numbers were worse for the fast-food industry, where more than half — 52 percent — of fast-food workers are in families where one or more family members relies on a public program.
But does this claim hold water?
Let’s review the way the SNAP (food stamp) program works.
The basic eligibility for the program uses three tests: an asset test, a gross income test, and a net income test. The gross income test requires that one’s total monthly income must be less than 130% of the poverty line, and the net income test requires that after certain deductions such as child care or high rent income be less than 100% of the poverty line. People receiving TANF (traditional “welfare”) or SSI (Supplemental Security Income, that is, benefits for the elderly or disabled whose benefits from Social Security aren’t enough to live on) are automatically eligible. The program provides a “maximum monthly allotment” which is then reduced by 30% of one’s net income. In addition, “earned” income, or wages from work rather than welfare benefits, factors in twice : first, the “net income” calculation subtracts out 20% of that income, and then the maximum benefit is reduced by 30% of net income. (Here’s another longer list of different types of income and how they’re classified; pension payments are deemed countable unearned income, for example.)
(How much do these various sorts of deductions from gross income affect benefits? Here’s an older and math-heavy analysis that I’m bookmarking for later.)
This means that someone under age 65 with literally no income at all receives the full SNAP benefit, but someone who is working, but earning wages low enough to still qualify for food stamps, gets a partial benefit.
Now, recall that “poverty level” is theoretically calculated based on the notion that people spend 1/3 of their budget on food, so that a bare-minimum food budget is calculated and multiplied by three. At the same time, the Food Stamps base benefit (before income adjustments) is based on that same food budget, called the Thrifty Food Plan. So in principle the benefit ought to phase out in exactly such a manner that the eligibility threshold is exactly equal to that point at which the benefit fully phases out, and there’s no point at which a $1 boost in income causes a drop of far more than that in benefits, that is, that there’s no “welfare cliff.”
And here’s where I did the math, discovered there is a “welfare cliff,” and went down a rabbit hole to find out why. So before I show you some tables, here’s the rabbit-hole part:
How is the poverty level calculated? The poverty level was first calculated in 1963, based indeed on this “food budget times three” method. But it is not updated by taking annually updated food costs and multiplying by three. Instead, it is simply increased by the overall CPI each year. What’s more, the the poverty levels are standardized for different household sizes: in 2020, it’s $12,760 per year for a single person and increases $4,480 for each additional person. (There is an alternate measure which tries to correct this fundamental flaw, called the Supplemental Poverty Measure, but that’s a whole ‘nother rabbit hole.)
But food stamp benefit’s calculation is different. It starts with a “Thrifty Food Plan” cost for a family of four including two adults and two children, ages 6-8 and 9-11. Then it assumes certain economies of scale are lost or gained with smaller or larger family sizes: one person has food costs that are 20% more than a mere proration of the Thrifty Food Plan numbers; two people have costs that are 10% more than a simple proration; 3 people, 5% more, 5 or 6 people, 5% less, and 7 or more people, 10% less. (You’d think that these adjustments would also reflect the differences in family composition but they don’t, just family size. Is the adjustment for a single person really the right boost considering that an adult male, looking at the Food Plans themselves, is considered to have food costs 33% higher than a 6-8 year old child, and that poor children have much of their food needs during the school year with in-school breakfast and lunch? Why don’t they just provide food stamps based on actual Thrifty plan amounts by age for each household member? Dunno.)
At any rate, there is a mechanism that’s intended to adjust eligibilities to avoid this cliff, at state’s discretion, called “categorical eligibility.” I’ll be honest — I’m not clear on all the particulars here, but to avoid going down another rabbit hole, I’ll just leave this here as a justification for some of the following calculations which use the phase-out income levels rather than the “official” income cut-offs.
But wait, there’s more!
Remember the “Food Stamp Challenge”? Yes, it was preposterous that people took the average benefit (remember, lower than the maximum benefit because it reflected the expectation that working people should spend some of their income on food), bought purchases based on their usual buying habits and without any meal planning or buying in volume, then declared it inhumane?
While that wasn’t credible, there are serious concerns about the reasonableness of the Thrifty Food Plan as a basis for food stamp budgets. Although the TFP is based on households cooking from scratch in order to maximize the food and the nutrient levels they can manage on the budget, and a household with an unemployed mother on welfare could in principle do this — or a low-income household with a traditional stay-at-home mother could (but once the kids are in school, she’d have to work at least 30 hours per week to qualify for Food Stamps), but it becomes much harder for a working single parent to do so. For example, according to the Center on Budget and Policy Priorities, non-SNAP households spend 36 minutes per day preparing food, SNAP households spend 50 minutes, and one estimate of the time it takes to actually cook meals using SNAP-appropriate menus would be 138 minutes per day. (That seems like a lot. I assume that the TFP assumes you get your protein from beans, which take a while to prepare, but I’d like to know whether they do their math based on total cook time — beans soaking or simmering while a parent does other tasks, for instance — rather than the “active work time” such foods require; the article they cite on the subject is tightly paywalled.)
As a result of these sorts of disputes, back in 2019, House Rep. Alma Adams introduced a bill that would shift the basis for SNAP benefits to the “low cost meal plan,” an increase of 30% in benefit levels. The bill was reintroduced in 2020 along with a companion Senate bill sponsored by Senators Kamala Harris and Bernie Sanders, as the Closing the Meal Gap Act of 2020. (The bill would also add Puerto Rico and the various territories to Food Stamp eligibility based on the same poverty rate thresholds as are in use in the United States — and, yes, in checking on this, I was surprised to learn that the government calculates poverty rate thresholds for Puerto Rico, American Samoa, and Northern Mariana Islands on the same basis, even though this produces a “poverty rate” for the last of these of 52% in 2010, according to Wikipedia.)
Would this be the right change? I’ve said before that the largest explanation for the reports of “people can’t live off their food stamp allocations” is surely that, without similar subsidies for housing or other expenses, they try to get their SNAP allocation to cover as much of their food costs as possible, or at any rate, think of it that way, to try to stretch their earnings to cover rent, transportation, and all their other expenses. Looked at in those terms, would suggest that “Food Stamps” should be replaced a “core living needs” benefit on the approach that a person can couch-surf or double-up but that food is a non-negotiable cost, but that it would nonetheless phase out over time.
What if the Low-Cost Food Plan were adopted to replace the Thrifty level, and the math was adjusted so that eligibility levels were set at the level at which, with a 30% of earnings offset, the benefit would finally be reduced to 0?
Adding all this together gets us to the following tables.
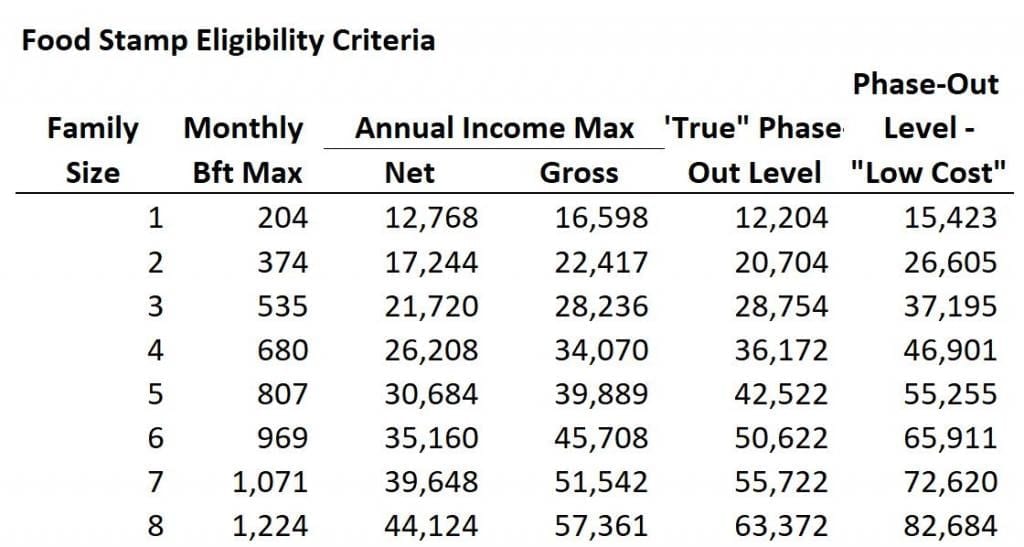
First, here’s a summary of the eligibility criteria and the true phase-out points, assuming that categorical eligibility fixes the “cliff” problems. I’ve applied the same math to a hypothetical alternate benefit using the “low-cost” plan. Does it surprise you that these income levels are so high? To be sure, I have not dug up the percentage of SNAP recipients who have 3 or 4 children, but I presume the numbers are significant.
To get a sense of the significance of these wages, here are their relation to overall personal income statistics in the United States, based on a “percentile calculator.” As you’ll recall from math class, percentiles are rankings — a percentile ranking of 49th means that 49% of the working population earns less than this level.

And finally, using again, the “true” phase-out point based on the formula rather than the eligibility wages, because of the “categorical eligibility” work-around, here are the wages a single worker would need to earn, for each family size, for each of the actual benefit and the proposed increased benefit, and for a 30 hour (kids in school) and full-time workweek.
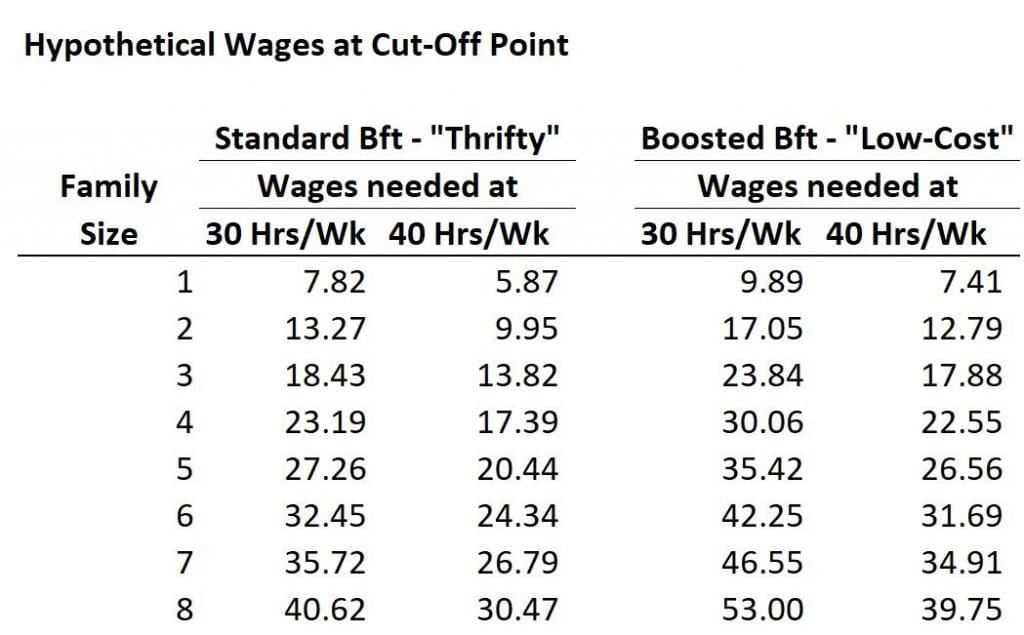
Granted, there are unlikely to be too many families with one worker and 7 dependents, but even at entirely likely family sizes — single mom and 3 kids, for instance — the wage she’d need to earn to be wholly ineligible for food stamps is high enough that it well exceeds the supposed “starvation wages.”
(Of course, towards the cut-off, a potential recipient might find it not worth her time to wade through the bureaucracy only to receive a small check each week, but it’s still important that benefits phase out smoothly, rather than being lost for a small pay increase or weekly hours boost.)
Also, remember that these are based on the standard formulas, but don’t take into account adjustments for childcare (that is, we’re assuming that a single mom has her childcare paid for with a voucher rather than out of pocket) or excess medical or housing expenses which factor into “net income.”
This is a lot of math and a lot of text to get to this point: it is the right thing to do, for “welfare” benefits to phase out as earnings increase, and it is not reasonable to expect that every possible job would pay so much that they would exceed these thresholds. Indeed, even if the labor market were so tight that starting wages for any possible job were so high as to exceed any reasonable phase-outs on a full-time basis, it is still a reality of the world that not everyone will work full-time — whether they’ll choose shorter hours, be unable to find full-time work, or be unable to accept it for any number of reasons.
Finally — yes, I have dodged the question of whether an employer such as Walmart has a moral or ethical obligation to offer wages that are higher than the mom-and-pop grocery store next door, or McDonald’s, vs. the local carry-out place, because of their (presumed) higher profit margin. That’s a bit of begging the question. Are Walmart’s wages in fact lower than the wages for a mom-and-pop grocery store, for apples-to-apples positions and for someone of the same skill level? (Let’s be honest: when you shop at your local Walmart and can’t find what you’re looking for, do you ask for help? Do you receive the help you’re looking for?)
And having said all that, let’s look further at the GAO report.
It found that, among SNAP recipients who were wage earners, they were more likely to work at small employers (like the mom-and-pop grocery) than large ones. 41.1% of SNAP recipients worked at employers with 1,000 or more employees; in comparison, among the non-SNAP-receiving workforce, 45.9% worked there. 4.7% of SNAP recipients worked at employers with 500 to 999 employees vs. 5.5% of the rest. In comparison, 17.6% of SNAP recipients worked at employers with fewer than 10 employees, vs. 13.5%, and 17.2% worked at 10 – 24 employee-sized employers, vs. 14.6%. To do some addition: 34% of SNAP recipients worked for small employers vs. 28.1% of the rest of the workforce.
The disparities, and the concentration among small businesses, are even starker for Medicaid recipients which the report also analyzed: 40.8% of Medicaid enrollees work at businesses with fewer than 25 employees, compared with 27.4% of the non-Medicaid workforce.
But what about the shocking numbers for Walmart?
To take the first state in their state-by-state analysis for which Medicaid and SNAP data is available, in Georgia, Walmart employees account for 2.1% of all working Medicaid enrollees, and 3% of all SNAP enrollees, according to the report. Are those outrageous numbers? It’s hard to say.
Helpfully Walmart itself tells us that there are 60,664 employees in total in Georgia. Since there are 3,959 Walmart employees on Medicaid, that’s 6.6% of all Walmart employees. Likewise, 4,023 or 6.7% of all Walmart employees receive food stamps.
The report also tells us that 11.9% of the working SNAP-receiving population of 136,130 works in the occupational category “sales and related occupations.” According to the BLS, there are 4,471,860 people in the overall Georgia employed population, and 471,770 in this occupational category, so 10.5% of the total. Doing the math another way, there are 16,199 SNAP receivers (approximately) in this occupational category, or 3.4% of people in these jobs receive Food Stamps, compared to the 6.6% number I just calculated.
But is this number even meaningful? Half of this category is cashiers and other retail sales employees. The remainder consists of such workers as sales representatives, supervisors, and so on. Again, we don’t know whether Walmart takes on the least-skilled of these workers, or nefariously takes on workers who are just as competent as anyone else but still manages to pay them poorly. Heck, it could even be that Walmart is being a “good corporate citizen” by offering jobs which are relatively more attractive to single mothers, and for this reason, a greater proportion end up being users of Food Stamps.
So have you made it to the end of this blog post? Yes, in a perfect world I would rework the text to make it publishable, but regular readers will know that I’ve whined before about the difficulty of figuring out a platform from which to shout things like, “low-wage workers receiving government benefits is a sign that the system is tolerably well-designed, you fools!” So in the meantime, please give me a virtual pat on the back and tell me I have not wholly wasted my time.