By guest contributor Dr. Alejandro Díaz-Domínguez*
This analysis originally appeared in the Nexos online blog “Data Workshop” (Taller de Datos) as “¿Qué nos dice el Censo 2020 sobre religión en México?” available in Spanish here (https://datos.nexos.com.mx/?p=1914). Special thanks to the Nexos editors for kindly accepting the reproduction of this essay, and Professor Andrew Chesnut for publishing this translation.
On January 25, the results of Mexico’s 2020 Population and Housing Census were released. The first figures that attracted the most attention in terms of religion were the comparisons between 2010 and 2020: a lower percentage of the Catholics (from 82.7% to 77.7%), a higher percentage Protestants and Evangelicals (from 7.5% to 11.2%) and, above all, a higher percentage of people with no religious affiliation (Religious Nones) [from 4.7% to 8.1%, with an additional 2.5% of people with no religious affiliation].
Subsequently, in social networks we observed various compilations and visualizations in tables, graphs, and maps. This text joins these efforts. I offer three preliminary analyses of the data delivered by the 2020 Census: the national level, state level, and some notes on religious competition. For this purpose, historical comparisons will be made since 1895 and more contemporary ones, using data from the last four censuses.
The National Level
The first step for a general comparison is to look at historical records. Graph 1 shows data on religion for 125 years of history and the percentages of the three main religious groups: adherents of the Catholic Church, Protestant and Evangelical churches, and those with no religion from 1895, the first year of census records, as released by INEGI (National Institute of Statistics and Geography), to 2020. Between 1895 and 1910 Catholicism was around 99%. The first decline, of a couple of points, took place during the Mexican Revolution, reaching 97.1% in 1921. By 1930, after the Cristero War, Catholicism rebounded slightly to 97.7%. Then in 1940 it dropped one point, after the application of anticlerical laws at the end of the Cristiada.
The last upturn was observed in 1950. In that year, official data reported a population of zero with no religion, which brought Catholicism to 98.2%. From that year on, there was a gradual decline to 92.6% in 1980. By 1990, the decline was three points, to 89.7%; and then another two points in 2000, to 87.9%, and then 5.2% less in 2010. As of 2020, the percentage of Catholic population is 77.7%, which is down 19 points since 1980, and 10.2 points less since 2000.
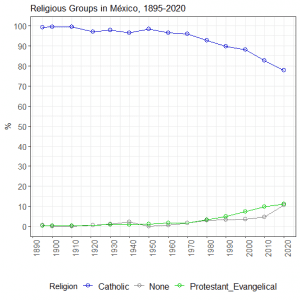
On one hand, Mexicans who declared belonging to Protestant and Evangelical churches increased from 3.2% in 1980 to 7.3% in 2000, and 11.2% in 2020. For perspective: in 1940 they represented less than one percentage point of the Mexican population (0.91 %), 1.3 % in 1950, 1.7 in 1960, and 1.8 in 1970. The growth since 1980, which has been extensively studied particularly in the southeast of the country (Casillas 1996), can be clearly seen in graph 1, in which 11.2% of the population declares belonging to a Protestant or Evangelical church.
On the other hand, those who declared themselves to have no religion reached one percent for the first time in 1930 (1.06 %), and 2.3% in 1940. As has also been documented (Camp 1997), in 1950 there were no reports of people without any religious affiliation. However, by 1970 they had reached 1.6%, 3.1% in 1980, 4.7% in 2010, and 10.6% in 2020, when considering those with no religion and those who reported themselves as believers, but without religious affiliation. In summary, in Mexico one out of ten does not belong to any religious group.
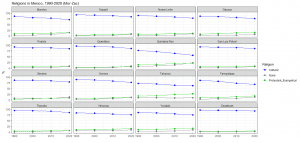
Moving from the historical overview at the national level to the type of localities that exist in the country in 2020, Graph 2 shows 14 categories of locality size according to the number of inhabitants, as defined by INEGI, by religious group. It should be noted that in each group a different scale is used on the vertical axis, to clearly observe patterns along the locality size. In the case of Catholicism, in localities between 1,000 and 99,000 inhabitants, it reaches a consistent 80%, figure 2.3 indicates higher than the national average. In localities with between 250,000 and one million inhabitants, a value lower than 80% is observed.
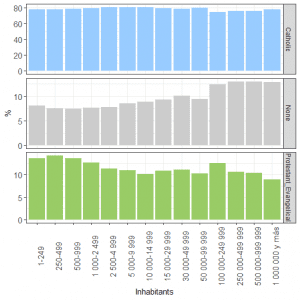
The presence of Protestants and Evangelicals is higher than the national average in towns with less than 10,000 inhabitants. There is a consistent 11% in localities with between 50,000 and one million inhabitants, with the exception of localities between 100,000 and 250,000 inhabitants. It is this same category in which the percentage of Catholics decreases to 80%. In the most populated areas, Protestants and Evangelicals come in at two points lower than the national average. Finally, the presence of people with no religion in which they exceed their national average by five points is concentrated in localities with between 100,000 and 250,000 inhabitants.
The data offered above, although still very aggregate, allows us to preliminarily conclude that the more rural areas have a Catholic, Protestant and Evangelical presence, the medium-sized cities have the presence of all three groups (between 100,000 and almost 250,000 inhabitants), and in the largest cities, Catholicism and those who report having no religion stand out.
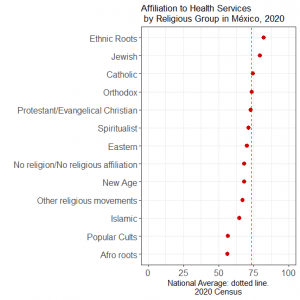
Finally, Graph 3 offers a crossover with a greater breakdown of other religious groups according to coverage by national health services, in which one out of every four inhabitants is not covered. The religious groups with a higher coverage than the national average is what INEGI classifies as religions with ethnic roots, Jewish communities, and Catholic, Orthodox, Protestant and Evangelical Christian churches.
Spiritualists and members of oriental churches are located to the left of the red line that indicates the national average (74%), as well as people with no religion and no religious affiliation, new age, and other religious movements. Slightly further away from the national average are Muslim communities and, at the end, popular cults, and religions with African roots, suggesting that a religious division will not necessarily explain coverage by health services (or lack thereof), but it could also be associated with conditions of marginalization.
The State Level
For the comparisons of the states, four census years were used -1990, 2000, 2010 and 2020-, and the population data were standardized to make them comparable, using populations aged 5 years and older, both in the totals, and in the three religious groups in question. For each state and year, the percentage of each religious group was obtained by dividing the number of people who reported belonging to the respective group by the total population of the entity; in both cases, I used the population aged 5 years and older.
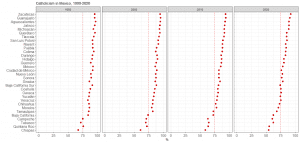
Graphs 4, 5 and 6 show Catholics, Protestants and Evangelicals, and those with no religion by year and state, respectively. Graph 4 shows Catholicism and highlights that in 1990 only two states had less than 75% of a Catholic population (Chiapas and Tabasco),but by 2000 there were five (the previous two plus Baja California, Campeche, and Quintana Roo). In 2010 it increased to six states with the addition of Tamaulipas, and jumped to 10 states in 2020 (Baja California Sur, Chihuahua, Morelos, and Yucatán were added).
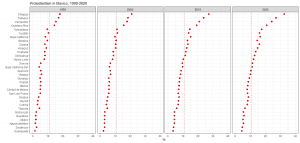
Protestants and Evangelicals at the state level and by census year are shown in Graph 5. In 1990, four states had 11% or more of both (Campeche, Chiapas, Quintana Roo, and Tabasco). By 2000, there were six states (Tamaulipas and Yucatán were added); by 2010 there were 12 states (Baja California, Chihuahua, Coahuila, Morelos, Oaxaca, and Veracruz were added), and by 2020 there were 15, almost half of the states (Baja California Sur, Nuevo León, and Sonora were added).
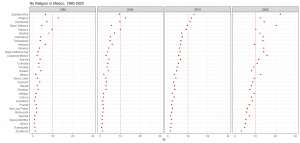
Finally, people with no religious affiliation are shown in Graph 6. In 1990 only one state had 10% or more (only Chiapas with Tabasco close at 9.6 %). In 2000, it would still be only one (Chiapas again, although three would be very close to 10%), but in 2010 there were three more states (Campeche, Quintana Roo, and Tabasco). For a brief overview of those with no religious affiliation in 2010, see Díaz-Domínguez (2014). By 2020 there are 14 states with 10% or more of people with no religion, or who report themselves as believers, but having no religious affiliation (Baja California, Baja California Sur, Campeche, Coahuila, Chiapas, Chihuahua, Mexico City, Mexico, Morelos, Quintana Roo, Sinaloa, Sonora, Tabasco, and Tamaulipas).
The three states with the highest proportion of people with no religion are Quintana Roo (22.5%), Baja California (20.4%), and Mexico City (15.6%).
In Graphs 4 and 5 – which show Catholics, Protestants and Evangelicals – it is noteworthy that the order of the states remains relatively stable, with some shifts between Catholics in Mexico City, and Protestants and Evangelicals in Baja California and Morelos. However, in Graph 6, those with no religion no longer show the reasonably ordered pattern of 2010, taking on a somewhat different order in 2020.
Graphs 7 and 8 offer a perspective with details at the state level over 40 years. They present, in alphabetical order, 16 states to clearly appreciate patterns in each one of them. Although the information they contain has already been presented in the three previous graphs, they may be useful for specific queries by state.
Religious Competition
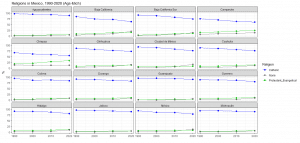
The effective number of religions was calculated considering the three major religious groups analyzed throughout this essay. For each state, their percentages in decimals were squared and summed. The result is usually called N. Subsequently, the inverse (1 / N) was calculated. The resulting figure per state and census year was called the Effective Number of Religions (ENR). This indicator has been used to illustrate the level of religious competence (Trejo, 2009).
The results are presented in Graph 9 in which each state has three circles, one for each religious group. Four panels are shown, one for each census year, and the data are ordered by the percentage of members of each religious group and the actual number of religions. A dotted gray line highlights the cutoff of two effective religions.
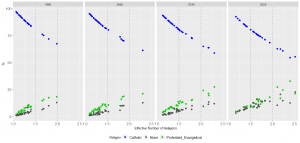
In 1990, no state had two effective religions (Chiapas had 1.98), while four had between 1.5 and 2 ENR (Campeche, Chiapas, Quintana Roo and Tabasco). The rest of the country had less than 1.5 ENR. By 2000, this panorama changed somewhat with one state with 2.3 effective religions (Chiapas), and five states between 1.5 and 2 ENR (Baja California, Campeche, Morelos, Quintana Roo, and Tabasco).
In 2010, there were four states with two effective religions (Campeche, Chiapas, Quintana Roo, and Tabasco), and seven between 1.5 and 2 (Baja California, Coahuila, Chihuahua, Morelos, Tamaulipas, Veracruz, and Yucatán). Finally, in 2020 we have one state with more than 2.5 effective religions (Quintana Roo), four with more than 2 (Baja California, Campeche, Chiapas, and Tabasco), and 15 states between 1.5 and 2 ENR. In other words, from 28 states in 1990, Mexico went to only 12 with less than 1.5 effective religions, and from no states with two effective religions in 1990, to five in 2020, and in the middle of this, states between 1.5 and 2 religions have also increased: 4, 5, 7, and 15 for 1990, 2000, 2010, and 2020, respectively.
Some Preliminary Conclusions
Over the past 20 years Catholicism has shown a gradual decline at the national level of 10 points. In contrast, in the same period, Protestants and Evangelicals have increased by almost 4 points, while those with no religion have increased 7 points. The religions with popular cults and African roots are the ones with the lowest percentage of people covered by health services. This suggests that beyond some religious factors, this low rate of coverage could be associated with some conditions of marginalization. On the one hand, Catholics seem to have a greater presence in small towns and large cities; Protestants and Evangelicals seem to have a higher percentage of followers in very rural localities and medium-sized cities, while people with no religion are concentrated in urban localities.
On the other hand, religious competition at the state level has five states with more than two effective religions, Mexico City with more than 15% of residents with no religion, and four states that still have a Catholic population of 90% (Aguascalientes, Guanajuato, Jalisco, and Zacatecas). Finally, eight states have population of 15% or more Protestants and Evangelicals (Baja California, Campeche, Chiapas, Oaxaca, Quintana Roo, Tabasco, Tamaulipas, and Yucatán), with Chiapas (32.5%), Tabasco (27.1%), Campeche (24.3%) and Quintana Roo (20.9%).
Undoubtedly, this mosaic of religious changes in Mexico revealed by the 2020 Census will require further exploration and detailed analysis of the microdata to know other relevant aspects, such as years of schooling, marital status, and type of marriage (religious, civil, common law marriage), number of children, households with female heads, and income levels, among many other variables. The changes preliminarily detected here suggest that secularization, through those who declare themselves to have no religion, is making inroads in some of the large urban centers, but in medium-sized cities and rural areas this does not seem to be the case. However, there is already a clear need for additional studies on this group, which may yield findings similar to those of Sarah Wilkins-Laflamme in the Canadian case (2020).
In regard to Catholicism in Mexico, despite its gradual decline at the national level, it remains a religion with high percentages, at least among the most populous countries in the world. In other words, of the 11 most populous countries in the world, the percentage of Catholicism in Mexico is the highest: in absolute numbers it is only surpassed by Catholicism in Brazil and it is 15 million greater than in the Philippines, the nation with the world’s third largest Catholic population. Taken together, all this information suggests that great diversity exists as more detailed analyses are carried out, which will surely emerge as the available Census data are explored in greater depth.
The files with the data and the script in R to replicate graphs are available here (aquí).
*Dr. Alejandro Diaz Dominguez is Professor at the School of Goverment, Tecnológico de Monterrey. Follow him on Twitter here.
References
Rodolfo Casillas, “La pluralidad religiosa en México: descubriendo horizontes”. in Giménez, Gilberto (coord.) Identidades religiosas y sociales en México, UNAM-IFAL. pp. 61-191, México, 1996.
Roderic Ai Camp, Cruce de Espadas. Política y Religión en México, Siglo XXI, México, 1997.
Alejandro Díaz-Domínguez, “The religiously unaffiliated in Mexico: a portrait” Stats, Political Science and Religion, 2014.
Guillermo Trejo, “Religious Competition and Ethnic Mobilization in Latin America: Why the Catholic Church Promotes Indigenous Movements in Mexico” American Political Science Review 103(3): 323-342, 2009.
Joel Thiessen and Sarah Wilkins-Laflamme, None of the Above: Nonreligious Identity in the U.S. and Canada, New York University Press, New York, 2020.