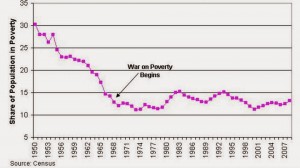
Apropos of Monday’s post about Lies, Damned Lies, and Statistics, Mike Flynn (science fiction writer and statistician) carries on with a related problem: the measure with which you measure. He looks at the U.S. poverty rate over the last 50 years: the percentage of the population that’s living below the poverty line. We have data on the poverty rate going back to LBJ’s war on poverty, which began fifty years ago.
 But what is that data, really? It’s a measurement; and unless you know precisely what was measured, you don’t know what it means. And like all measurements involving the quality of life of men and women, it’s fuzzy—and that raises many questions. Does the measurement we make really measure what we want to measure? Did we measure it the same way for the entire span of time? Should we have measured it the same way for the entire span of time? Should we measure it differently now?
It’s a hard question to answer. Looking at Flynn’s chart, we see that the poverty rate has varied between 10 and 15% since 1965; and yet, research shows that people living below the poverty line are living more comfortable lives than in 1965. More own their own homes, more have TVs and air conditioning, fewer report going hungry. Yet the fraction in “poverty” is about the same. Is this a problem with the measurement? It’s hard to say; it depends what you’re using it for.


