As some readers may know, the 2nd report on religion in Asian America was released. Given the additional time the advisory board (including me and over a dozen professors who do Asian American research) was given to send in comments and the notable changes incorporated into the final product, many of us feel a little better about this report than the first one. In this post I want to share the challenges of understanding religious prevalence in a hard-to-reach group. In the limited history of Asian American data collection (of the national-level variety), compromises are often made in one of two ways: obtain a stratified and fairly random sample in English or translate the survey in the major Asian language groups. Since trying to survey a smaller group that constitutes about 5-6% of the population, both of these factors are important and costly.
The implications of these differences are big when it comes to understanding religion in Asian America. What happens to the proportional distribution of Asian ethnic Christians based on different sampling techniques? (Some have wondered whether one particular ethnic group dominates Asian American Christianity or whether it’s an even spread across all groups).
CAVEAT: To keep matters simple and consistent across three survey examples, I am limiting the discussion to the six largest Asian American groups which have been unchanged since the 1990s: Chinese, Filipino, South Asian Indians, Vietnamese, Korean and Japanese in roughly that order). Surveying groups smaller than these (e.g. Bangladeshi, Cambodian, Laotian, Pakistani, Thai plus at least 20 others) will require some innovative survey techniques or way more research money than most scholars can acquire through grants. That said, I humbly show only these top 6 groups knowing that these illustrations miss out on a significant swath of Asian Americans numbering in millions.
The first example is less randomly stratified but language-inclusive:
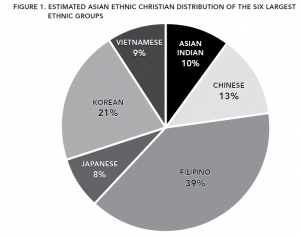
This snapshot was taken from a paper I wrote that tried to summarize the sociological study of Asian American Christianity. I created a pie graph of the top 6 Asian American groups all of whom described themselves as “Catholic”, “Protestant”, or “Other Christian.” I used the freely available survey, the Pilot National Asian American Politics Survey, 2001. While this survey was translated into 6 languages plus English for respondents to answer the survey was limited to 5 major cities with large Asian American populations (New York, Los Angeles, Honolulu, Chicago, San Francisco).
If you have used the PNAAPS, you’ll notice that the Christian Asian Indian figure is rather high. That’s because (as I state in the article) identifying some Asian Indians by surname (using marketing lists that try to approximate ethnicity or race based on household names) is really difficult when they are often based on important saints like Thomas, George etc. So I did some extrapolations based on other scholars who also gave best estimates and I came up with that rough number.
Aside from that this survey can basically tell us the proportion of adult Asian American Christians from 5 major cities around the year 2000.
This next one is more random and stratified but only done in English:
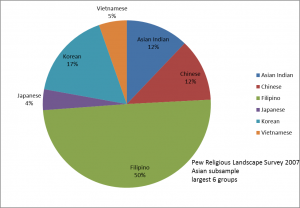
In 2007 the Pew Research Center released the Religious Landscape Survey, a massive survey of over 35,000 respondents. After appropriate weighting measures (basically adjusting the sample to approximate the population), this survey yielded about 800 Asian American respondents who gave detailed information. If survey respondents were not born in the US or if their parents were not born in the US, they were asked a follow up question of national origin. About a hundred or so only said they were Asian and did not submit any other identifying information and had no foreign-born ties of any sort. So this basically melds together any Asian American who was born in the US as a generic “Asian.” The other major problem with this survey is that it was only translated into Spanish. So that means Asian Americans (most of whom are foreign-born) were called in English to answer a complex survey. You can be sure that those who were not comfortable with their English proficiency didn’t continue the survey.
This chart tells us the prevalence of English-proficient adult Asian American Christians who were foreign-born or had foreign-born parents around 2007.
A social scientist is trained to report findings based on the parameters of the data. So in the case of the PNAAPS, the verbage for one of the data points would read: “Vietnamese American Christians represented about 9% of all Asian American Christians in 5 major cities with large Asian American populations [in 2001].” The Landscape Survey finding would read: “Vietnamese Americans who are English-proficient represented about 5% of all English-proficient Asian American Christians in the United States [in 2007].” That’s a lot of hedging but it’s faithful to the data.
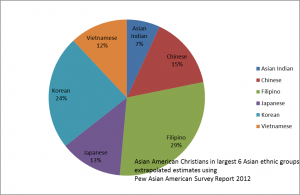
So we turn now to the new Pew Asian American Religions report. None of the advisory board members have access to the survey so I took the raw figures and punched them in my spreadsheet to get best estimates. This survey is stratified and random and translated into multiple major Asian languages within the largest 6 groups. This is what I found:
Time may be a significant factor here even when we account for methodological problems of the past. It’s possible that the PNAAPS and PRLS figures are close to the mark for their respective years. That said, if we see little fluctuation between surveys it might mean that accounting for language and stratified sampling does not make a big difference for this group; conversely if we do see big fluctuations, it might be a result of either of these two factors or something else like changes in immigration rates.
From personal experience, most of the Korean Christians I know are reluctant to answer a survey over the phone in English (trying to explain a medical condition or a legal issue is no small feat either). So when I see a jump from 17% of Asian American Christians are Korean in an English-only survey to 24%, I start thinking that maybe this survey picked up on those folks who can answer complex questions but in Korean only. The 3% difference between a 5-city survey and the new survey suggests to me that they are somewhat concentrated in certain major metro areas.
These explanations don’t make as much sense when I see the change in Japanese American figures. Since Japan is much less Christian, making a survey available in Japanese (I would think) would lower the proportion of Japanese American Christians (even if there is a pro-migration of Christians from Japan to the US, migration levels are very low in the past decade from Japan). On the other hand, it might be that Japanese American Christians are more dispersed than previous surveys found. The wildly different figures for Filipino American Christians suggests that many more of them (compared to other ethnic groups) are comfortable speaking in English, and to some extent they are likely less spread out (or geographically dispersed) compared to other groups.
Scholars and anyone interested in Asian American diversity have a better survey now and can make stronger statements (depending on the issue) about the prevalence rates in Asian America. To use the previous example about Vietnamese American Christians the new survey allows us to say this: “Vietnamese American Christians took up about 12% of all Asian American Christians [in 2012].” Simpler statements like this are possible when the sample is more rigorously obtained through sensitivity to location and language diversity. It also requires funding agencies to invest a lot for better data.
There’s much more to learn about religion in Asian America so I encourage readers to check it out. Hat tip to Pew for funding a well-executed survey.

