In a recent report by the Pew Hispanic Center, we had some new statistics available for the religious diversity within the Latino populations. The published findings only show us the registered voter group of Latinos surveyed which is not an identical match to the other figures I presented in a previous post, but until we can access the actual data , we may need to go with what we have. This got me thinking, why not try and pick up other data to create as comprehensive a picture as possible. So I pulled the figures on registered Hispanic voters and their religious affiliations for 2012. The nearest survey with a large enough sample of different religious African Americans was the Pew Religious Landscape Survey 2007. The nearest survey with a sizeable and reasonably representative sample of American Muslims was the Pew 2011 American Muslim Survey. However, I couldn’t access the race information that would help see racial variation within this religious affiliation.
Before we get to the figures, a few caveats. I readily admit that this is far from ideal, a lot has changed since 2007, and these changes to our political-economy could have an effect on party preference. So take these figures with a big grain of salt. My sense however is that generally the patterns don’t vary radically; that is, no major shifts amounting to a shift of 10% or more. Also here’s a breakdown of some of the shorthand:
AsAm = Asian American
AfAm = African American
(reg) = registered voter percentage, 2012
(’07) = Pew Landscape Survey 2007
(’11) = Pew American Muslim Survey 2011
Unless noted by the aforementioned, the figures refer to 2012 general percents not limited to registered voters.
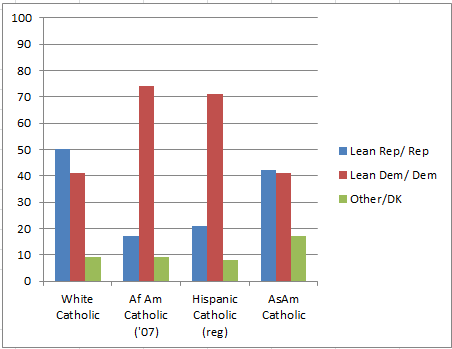
Figure 1: Catholics
When we include African American Catholics (assuming the 2007 figures don’t vary much from 2012), we find a strong Democratic preference that is slightly higher than the Hispanic Catholic preference. Republican preference is stronger among white Catholics and slightly more for Asian American Catholics.
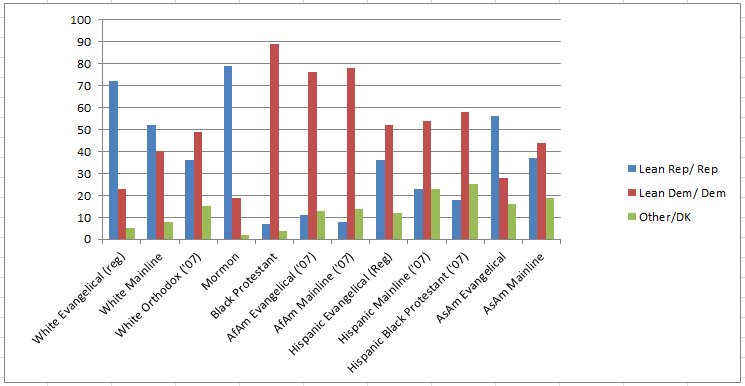
Figure 2: Non-Catholic Christians
I started the figures this time with Catholics because the second cluster is what I describe as non-Catholic Christians. I use this catch-all term because I found a sizeable group of Orthodox Christians (all of whom identify as white and non-Hispanic). This is the only predominantly white Christian group that actually leans more Democrat than Republican. Among African American Christians, there’s no contest, very clear preference for the Democratic party, regardless of whether they are in predominantly white religious traditions such as evangelical and mainline Protestantism or in a historically black Protestant tradition. Put this together with African American Catholics and we see strong majorities of all black Christians for one party over the other (again assuming little voter preference has changed since 2007 for this population). Among Latino non-Catholics, we a similar stronger preference for the Democratic party as African American Protestants but it’s not as pronounced. The largest presence of Republican presence is with Hispanic evangelical registered voters. In the 2007 data, we have enough respondents to look at the preferences of those Latinos who affiliate with an historically black Protestant tradition. We find that they also support the Democratic party more so than the GOP. With better inclusion of more racial diversity we see more clearly too that Asian American evangelicals are the only minority Christian group that leans more in favor of the Republican party than the Democrats.
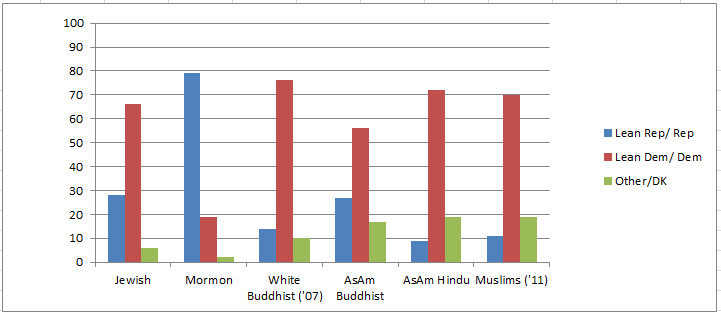
Figure 3: Other Religious Americans
Using the Landscape Survey from 2007 we have a large enough sample of white Buddhists to help us compare Asian American Buddhists (albeit tentatively due to the 5 year gap). White Buddhists clearly favor the Democratic party and more so compared to Jewish respondents. In fact we might say that of all the religious minority groups that have a substantial presence of white followers, white Buddhists are the most Democratic. They stand in contrast to Mormons (which is predominantly white) who are the religious minority group that clearly favors the Republican party. When we account for Muslim preferences (and they identify with a diverse array of racial labels so we can’t say how race might or might not work among them), we find that they follow other religious minority communities in greater support of the Democrat party.
Figure 4: the Unaffiliated
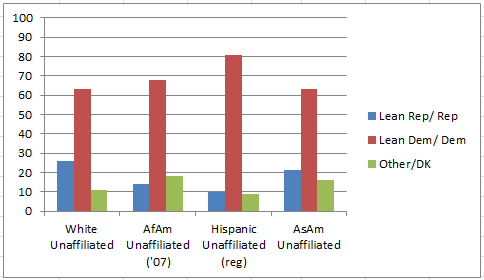 There’s amazing parity among the unaffiliated. Again, as long as there are no time effects or major differences between registered voters and all members of that group, nearly every racial group among the nonaffiliated identify as Democrat.
My conclusions from the previous analyses seem to be stable even when we account for more religious and racial diversity. The Democrat party is a very diverse tent and trying to develop a platform that appeals to these diverse constituencies and the particulars that affect their social and economic conditions is challenging. Republicans for the most part are still clearly a party of Christians, namely white Catholics, white evangelicals, Mormons, and Asian American evangelicals (and perhaps Asian American Catholics). This doesn’t mean that the GOP is devoid of non-Asian minorities, but they are clearly a minority within their religious traditions.
Share your other observations!

